Group statistics, source level
Here we analyze beamforming results for 25 subjects. Power was computed for each virtual sensor for the M170 window pow=mean(timecourse.*timecourse); the data was then interpolated over the template MRI.
Contents
- Load data and display raw data
- Neural Activity Index (NAI), compute subordinate to dominant ratio
- t-test for selected voxels
- cluster based permutation statistics
- Plot the significant clusters
- ROI mask
- Plot t distribution + Atlas
- Change the cluster alpha
- Plot methods: ortho (transparancy added)
- Plot methods: surface
- Plot method: slice
- AFNI clustering and simulation
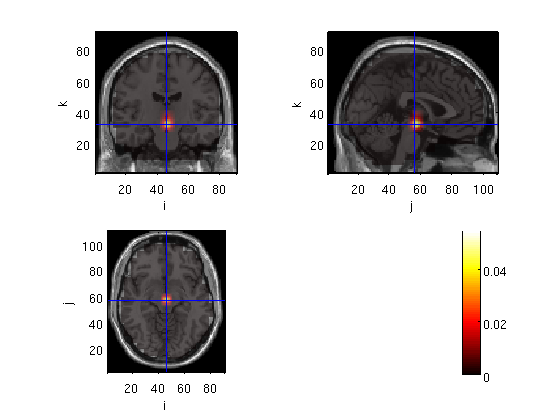
Load data and display raw data
the files to be loaded are output of ft_sourcegrandaverage, after masking voxels outside the brain.
cd amb
load domMskdp
load subMskdp
load ~/ft_BIU/matlab/LCMV/sMRI
subMskdp.anatomy=sMRI.anatomy;
cfg = [];
cfg.funparameter = 'avg.pow';
cfg.method='ortho';
figure
ft_sourceplot(cfg,subMskdp)
the input is volume data with dimensions [91 109 91]
not downsampling anatomy
not downsampling avg.pow
the call to "ft_volumedownsample" took 0 seconds and an estimated 0 MB
no masking parameter
voxel 312540, indices [46 56 32], location [0.0 -16.0 -10.0] mm, value 0.054797
scaling anatomy
scaling anatomy
scaling anatomy
nas = undefined
lpa = undefined
rpa = undefined
the call to "ft_sourceplot" took 0 seconds and an estimated 0 MB

ans =

           funparameter: 'avg.pow'
                 method: 'ortho'
            trackconfig: 'off'
            checkconfig: 'loose'
              checksize: 100000
           showcallinfo: 'yes'
          maskparameter: {}
             downsample: 1
                  title: ''
                  atlas: []
                 marker: []
             markersize: 5
            markercolor: [1 1 1]
           anaparameter: 'anatomy'
            funcolormap: [64x3 double]
            funcolorlim: 'zeromax'
             opacitymap: [1x64 double]
             opacitylim: 'auto'
                    roi: []
               location: 'auto'
    locationcoordinates: 'head'
              crosshair: 'yes'
               colorbar: 'yes'
                   axis: 'on'
            interactive: 'no'
             queryrange: 3
               coordsys: []
                  units: []
                nslices: 20
               slicedim: 3
             slicerange: 'auto'
         surfdownsample: 1
               surffile: 'single_subj_T1.mat'
           surfinflated: []
           sphereradius: []
                projvec: 1
             projweight: 1
               projcomb: 'mean'
             projthresh: []
                distmat: []
               camlight: 'yes'
               renderer: 'opengl'
               callinfo: [1x1 struct]
                version: [1x1 struct]
               previous: [1x1 struct]
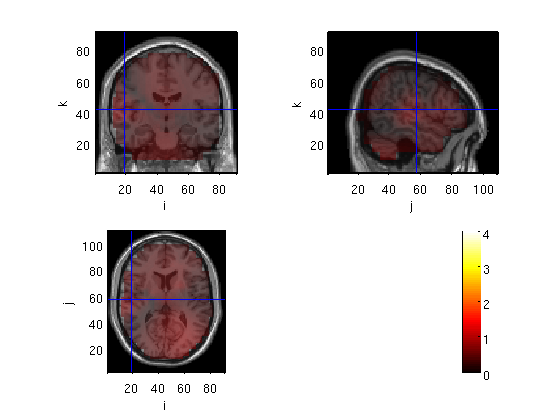
Neural Activity Index (NAI), compute subordinate to dominant ratio
sub_dom=subMskdp;
sub_dom.avg.nai=(subMskdp.avg.pow-domMskdp.avg.pow)./domMskdp.avg.pow;
cfg.funparameter = 'avg.nai';
%cfg.interactive = 'yes';
cfg.location=[55 -15 10]
cfg.funcolorlim=[0 4];
ft_sourceplot(cfg,sub_dom)
cfg =

    funparameter: 'avg.nai'
          method: 'ortho'
        location: [55 -15 10]

the input is volume data with dimensions [91 109 91]
not downsampling anatomy
not downsampling avg.nai
the call to "ft_volumedownsample" took 0 seconds and an estimated 0 MB
no masking parameter
voxel 411794, indices [19 57 42], location [54.0 -14.0 10.0] mm, value 0.660093
scaling anatomy
scaling anatomy
scaling anatomy
nas = undefined
lpa = undefined
rpa = undefined
the call to "ft_sourceplot" took 0 seconds and an estimated 0 MB

ans =

           funparameter: 'avg.nai'
                 method: 'ortho'
               location: [55 -15 10]
            funcolorlim: [0 4]
            trackconfig: 'off'
            checkconfig: 'loose'
              checksize: 100000
           showcallinfo: 'yes'
          maskparameter: {}
             downsample: 1
                  title: ''
                  atlas: []
                 marker: []
             markersize: 5
            markercolor: [1 1 1]
           anaparameter: 'anatomy'
            funcolormap: [64x3 double]
             opacitymap: [1x64 double]
             opacitylim: 'auto'
                    roi: []
    locationcoordinates: 'head'
              crosshair: 'yes'
               colorbar: 'yes'
                   axis: 'on'
            interactive: 'no'
             queryrange: 3
               coordsys: []
                  units: []
                nslices: 20
               slicedim: 3
             slicerange: 'auto'
         surfdownsample: 1
               surffile: 'single_subj_T1.mat'
           surfinflated: []
           sphereradius: []
                projvec: 1
             projweight: 1
               projcomb: 'mean'
             projthresh: []
                distmat: []
               camlight: 'yes'
               renderer: 'opengl'
               callinfo: [1x1 struct]
                version: [1x1 struct]
               previous: [1x1 struct]
t-test for selected voxels
voxind=312631; %center of head
for subji=1:25
    sub(subji,1)=subMskdp.trial(1,subji).pow(voxind,1);
    dom(subji,1)=domMskdp.trial(1,subji).pow(voxind,1);
end
[h,p]=ttest(sub,dom)

voxind=361828; %right temporal
for subji=1:25
    sub(subji,1)=subMskdp.trial(1,subji).pow(voxind,1);
    dom(subji,1)=domMskdp.trial(1,subji).pow(voxind,1);
end
[h,p]=ttest(sub,dom)
h =

     0


p =

    0.2486


h =

     1


p =

    0.0114
cluster based permutation statistics
cfg=[];
cfg.dim = subMskdp.dim;
cfg.method      = 'montecarlo';
cfg.statistic   = 'depsamplesT';
cfg.parameter   = 'pow';
cfg.correctm    = 'cluster'; %  'no', 'max', 'cluster', 'bonferoni', 'holms', 'fdr'
cfg.numrandomization = 500;
cfg.alpha       = 0.05
cfg.clusteralpha= 0.05;
cfg.tail        = 0;
cfg.design(1,:) = [1:25 1:25];
cfg.design(2,:) = [ones(1,25) ones(1,25)*2];
cfg.uvar        = 1; % row of design matrix that contains unit variable (in this case: subjects)
cfg.ivar        = 2; % row of design matrix that contains independent variable (the conditions)
stat = ft_sourcestatistics(cfg,subMskdp,domMskdp);
save Cl05_M170masked_S_Dstat stat
cfg =

                 dim: [91 109 91]
              method: 'montecarlo'
           statistic: 'depsamplesT'
           parameter: 'pow'
            correctm: 'cluster'
    numrandomization: 500
               alpha: 0.0500

only selecting voxels inside the brain for statistics (28.0%)
using "statistics_montecarlo" for the statistical testing
Warning: doing a two-sided test without correcting p-values or alpha-level, p-values and alpha-level will
reflect one-sided tests per tail
using "statfun_depsamplesT" for the single-sample statistics
constructing randomized design
total number of measurements     = 50
total number of variables        = 2
number of independent variables  = 1
number of unit variables         = 1
number of within-cell variables  = 0
number of control variables      = 0
using a permutation resampling approach
repeated measurement in variable 1 over 25 levels
number of repeated measurements in each level is 2 2 2 2 2 2 2 2 2 2 2 2 2 2 2 2 2 2 2 2 2 2 2 2 2
computing a parametric threshold for clustering
computing statistic
estimated time per randomization is 0 seconds
computing statistic 1 from 500
computing statistic 2 from 500
.
.
.
computing statistic 498 from 500
computing statistic 499 from 500
computing statistic 500 from 500
found 4 positive clusters in observed data
found 0 negative clusters in observed data
computing clusters in randomization
computing clusters in randomization 1 from 500
computing clusters in randomization 2 from 500
.
.
.
computing clusters in randomization 497 from 500
computing clusters in randomization 498 from 500
computing clusters in randomization 499 from 500
computing clusters in randomization 500 from 500
using a cluster-based method for multiple comparison correction
the returned probabilities and the thresholded mask are corrected for multiple comparisons
the call to "ft_sourcestatistics" took 110 seconds and an estimated 1 MB
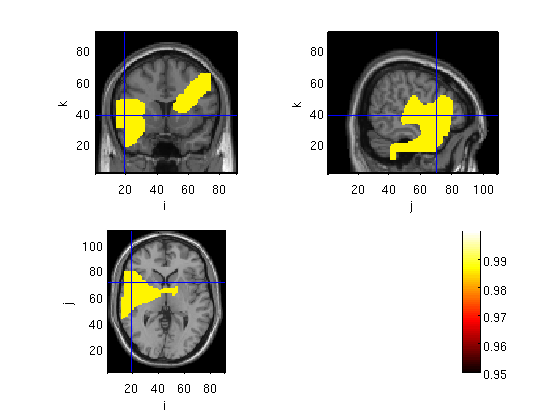
Plot the significant clusters
probplot=stat;
probplot.prob1=1-probplot.prob;
lowlim=0.95;
probplot.mask=(probplot.prob1>=lowlim);
probplot.anatomy=sMRI.anatomy;
cfg = [];
cfg.funcolorlim = [lowlim 1];
cfg.interactive = 'yes';
cfg.funparameter = 'prob1';
cfg.maskparameter= 'mask';
cfg.method='ortho';
cfg.inputcoord='mni';
cfg.atlas='~/ft_BIU/matlab/files/aal_MNI_V4.nii';
cfg.coordsys='mni';
cfg.roi='Frontal_Sup_L'
cfg.location=[-20 -44 40];% wer= -50 -45 10 , broca= -50 25 0, fussiform = -42 -58 -11(cohen et al 2000), change x to positive for RH.
%cfg.crosshair='no';
figure;
ft_sourceplot(cfg,probplot);
cfg =

      funcolorlim: [0.9500 1]
      interactive: 'yes'
     funparameter: 'prob1'
    maskparameter: 'mask'
           method: 'ortho'
       inputcoord: 'mni'
            atlas: '~/ft_BIU/matlab/files/aal_MNI_V4.nii'
         coordsys: 'mni'
              roi: 'Frontal_Sup_L'

the input is volume data with dimensions [91 109 91]
not downsampling anatomy
not downsampling mask
not downsampling prob1
the call to "ft_volumedownsample" took 0 seconds and an estimated 0 MB
reading aal_MNI_V4 atlas coordinates and labels
Rescaling NIFTI: slope = 1, intercept = 0
the call to "ft_prepare_atlas" took 0 seconds and an estimated 0 MB
Warning: The field cfg.box is forbidden, it will be removed from your configuration

Rescaling NIFTI: slope = 1, intercept = 0
the call to "ft_prepare_atlas" took 0 seconds and an estimated 0 MB
found 1 matching anatomical labels
constructing mask for Frontal_Sup_L
3599 voxels in mask, which is 0.399 % of total volume
the call to "ft_volumelookup" took 0 seconds and an estimated 0 MB

click with mouse button to reposition the cursor
press n/l/r on keyboard to record a fiducial position
press q on keyboard to quit interactive mode
voxel 559251, indices [56 42 57], mni coordinates [-20.0 -44.0 40.0] mm, value 0.000000
aal_MNI_V4 labels: not found
scaling anatomy
scaling anatomy
scaling anatomy
nas = undefined
lpa = undefined
rpa = undefined

click with mouse button to reposition the cursor
press n/l/r on keyboard to record a fiducial position
press q on keyboard to quit interactive mode
voxel 563164, indices [56 85 57], mni coordinates [-20.0 42.0 40.0] mm, value 0.986028
aal_MNI_V4 labels: Frontal_Sup_L
scaling anatomy
scaling anatomy
scaling anatomy
the call to "ft_sourceplot" took 215 seconds and an estimated 0 MB
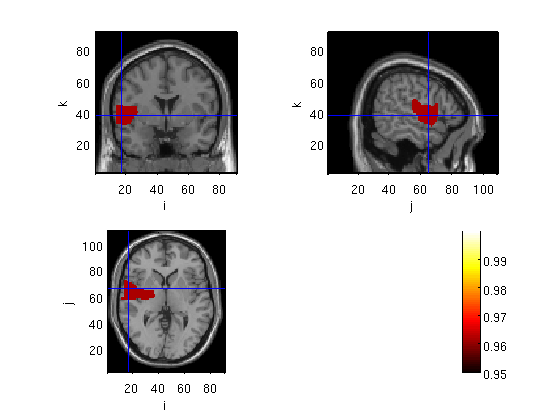
ROI mask
cfg.roi='Frontal_Sup_L'
cfg.location=[-20 -44 40];% wer= -50 -45 10 , broca= -50 25 0, fussiform = -42 -58 -11(cohen et al 2000), change x to positive for RH.
%cfg.crosshair='no';
figure;
ft_sourceplot(cfg,probplot);
cfg =

      funcolorlim: [0.9500 1]
      interactive: 'yes'
     funparameter: 'prob1'
    maskparameter: 'mask'
           method: 'ortho'
       inputcoord: 'mni'
            atlas: '~/ft_BIU/matlab/files/aal_MNI_V4.nii'
         coordsys: 'mni'
              roi: 'Frontal_Sup_L'
         location: [-20 -44 40]

the input is volume data with dimensions [91 109 91]
not downsampling anatomy
not downsampling mask
not downsampling prob1
the call to "ft_volumedownsample" took 0 seconds and an estimated 0 MB
reading aal_MNI_V4 atlas coordinates and labels
Rescaling NIFTI: slope = 1, intercept = 0
the call to "ft_prepare_atlas" took 0 seconds and an estimated 0 MB
Warning: The field cfg.box is forbidden, it will be removed from your configuration

Rescaling NIFTI: slope = 1, intercept = 0
the call to "ft_prepare_atlas" took 0 seconds and an estimated 0 MB
found 1 matching anatomical labels
constructing mask for Frontal_Sup_L
3599 voxels in mask, which is 0.399 % of total volume
the call to "ft_volumelookup" took 0 seconds and an estimated 0 MB

click with mouse button to reposition the cursor
press n/l/r on keyboard to record a fiducial position
press q on keyboard to quit interactive mode
voxel 559251, indices [56 42 57], mni coordinates [-20.0 -44.0 40.0] mm, value 0.000000
aal_MNI_V4 labels: not found
scaling anatomy
scaling anatomy
scaling anatomy
nas = undefined
lpa = undefined
rpa = undefined

click with mouse button to reposition the cursor
press n/l/r on keyboard to record a fiducial position
press q on keyboard to quit interactive mode
voxel 563255, indices [56 86 57], mni coordinates [-20.0 44.0 40.0] mm, value 0.986028
aal_MNI_V4 labels: Frontal_Sup_L
scaling anatomy
scaling anatomy
scaling anatomy
the call to "ft_sourceplot" took 12 seconds and an estimated 0 MB

Plot t distribution + Atlas
%cfg.parameter = 'stat';

statplot=stat;
statplot.anatomy=sMRI.anatomy;
cfg=[];
cfg=rmfield(cfg1,'funcolorlim');
cfg.funcolorlim = [-3.5 3.5];
cfg.funparameter = 'stat';
cfg.method='ortho';
cfg.inputcoord='mni';
cfg.atlas='aal_MNI_V4.img';
figure
ft_sourceplot(cfg2,statplot)
Error using ==> rmfield at 40
A field named 'funcolorlim' doesn't exist.

Error in ==> course12 at 96
cfg=rmfield(cfg1,'funcolorlim');
Change the cluster alpha
I arranged the stats and plots in a function. what we did so far is similar to this: [cfg1,probplot,cfg2,statplot]=ambMonteClust12('Cl05_M170masked_S_D','subMskdp','domMskdp',0.95,0.05); Now we change cluster criterion for 0.05 to 0.01.
[cfg1,probplot,cfg2,statplot]=ambMonteClust12('Cl01_M170masked_S_D','subMskdp','domMskdp',0.95,0.01);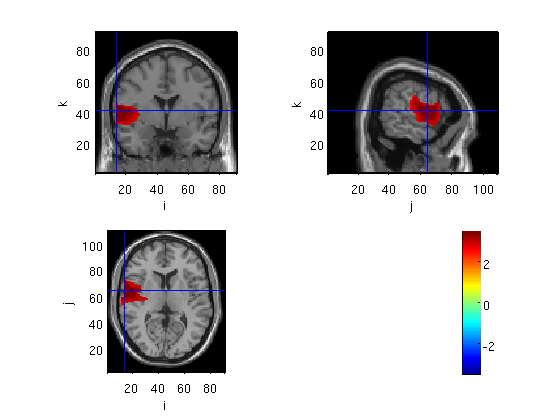
Plot methods: ortho (transparancy added)
ambPlotStat12('Cl01_M170masked_S_D',[0.95 0.98],'ortho',60);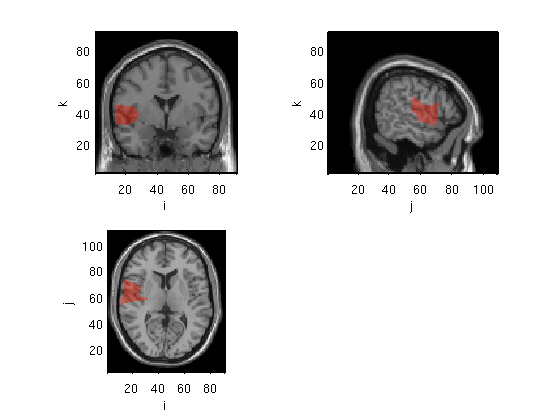
Plot methods: surface
ambPlotStat12('Cl01_M170masked_S_D',[0.95 0.98],'surface');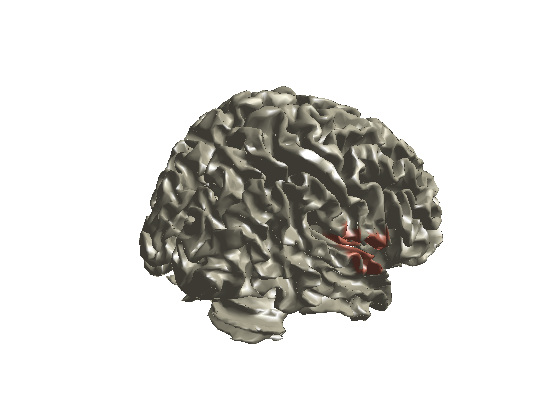
Plot methods: slice
ambPlotStat12('Cl01_M170masked_S_D',[0.95 0.98],'slice');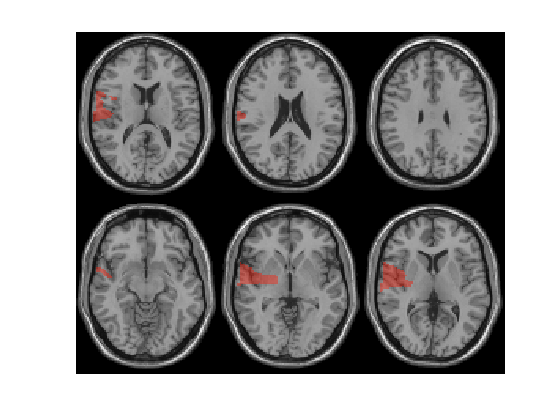
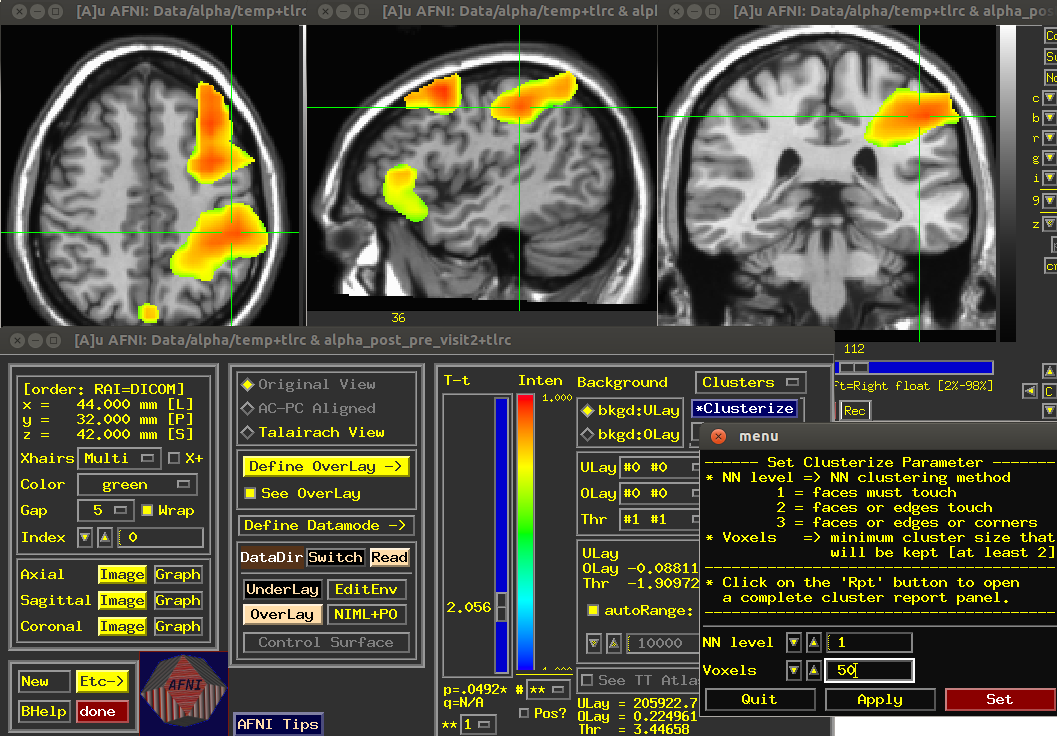
AFNI clustering and simulation
cd ../alpha
!~/abin/afni &